There is perhaps no Windows user who never experienced a BSOD (Blue Screen of Death) error when using the operating system. Unfortunately, most users do not know how to deal with these problems and not even how to detect the cause of this problem. The purpose of this article is to explain a way to interpret these errors and even teach you how to fix them.
What are BSOD errors?
First, a BSOD is generated either by a hardware failure (faulty RAM memory, an incompatibility between components, etc.) or a problematic piece of software (incompatible or damaged drivers, drivers that have not stood the test designed by Microsoft, etc.)
There are two tools that are generally recommendable when it comes to debugging BSOD errors: DebugWiz from WindowsBBS and BlueScreenView from Nirsoft.
Before using one of these tools, the following steps are recommended:
– Press Win key + Pause / Break to open System Properties;
– Click on the Advanced tab;
– Go to the Startup and Recovery section, click on the Settings button;
– Uncheck Automatically restart from the System failure section;
– Change the directory path in which to store log files; it is recommended to use any other partition than the one where the operating system is installed.

For the sake of this tutorial, we will use the tool called DebugWiz. This is available from WindowsBBS.com and when you open it you will see the following window:
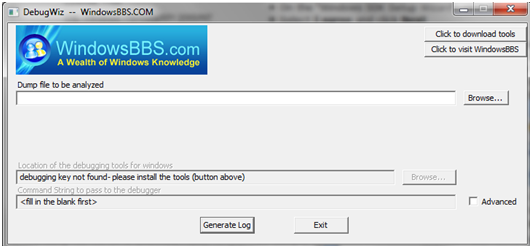
After you run the program the first thing you should do is to click the Browse button and navigate to the folder where the Windows debugger has been installed and select cdb.exe; Windows debugging tools are not normally integrated into the operating system, but can be easily obtained from Microsoft for free.
Next, in order to generate a log for a BSOD you need to go to look for a file with the .dmp extension in your computer. The name of such a file will contain the date and time when the error occurred. To generate a log, simply click on the Generate button to run a log. Immediately, a Command Prompt will open, displaying a message that will inform you that the log has been generated. The log will be in the form of a .txt file. By using this tool, the log generation will take some time but the information provided is complete, complex and useful.
Three of the fields you should look for in such a log file are MODULE_NAME, IMAGE_NAME and FAULTING_IP. After a quick Google search on the name displayed in these fields you will easily find the program that caused this error. In case of a driver, a file with the .sys extension will be displayed and the driver corresponding to it can be detected in the same way.
Interpretation of these details is very fast and very poor in details. The tool from Microsoft is generally recommended, as it provides multiple details about these errors.